

OK, so this article is a bit late. I was reading the january edition of Professional Surveyor Magazine and came across an article about “Mapping Windmill Farms.” The purpose of the article was to articulate the process to determine proposed locations of future windmills based on GIS data (municipalities, watersheds, soils, road acess, and proximity to residential areas). As I read the article, I was amazed at what they were doing, but stymied why they weren’t using the software I’m pretty sure they already had. What software is that you ask?
Anyone who has purchased Land Desktop or Civil 3D, you also own Map 3D. OK, what is that? That is Autodesk’s GIS application for creatng, editing and analyzing GIS data. Let’s list a few things that can be done with Map 3D that would benefit the everyday tasks of land development:
-
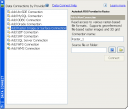
Reading Shapefiles (SHP), Digitial Orthophoto Quads (DOQ) and Digital Elevation Models (DEM). These are the typical file format of many GIS data layers as noted in the article. Map 3D can read these file types natively using FDO connections. (One thing about the GIS industry is all the acronyms they have 🙂 ) You don’t have to convert anything to DXF or strip away all the inherent data to get the linework.
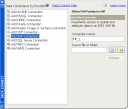
- All these various pieces of data are in different coordinate systems, UTM NAD 83, State Plane NAD 27, etc and there is no way in AutoCAD to “georeference” all of this data. Once you establish the coordinate system for the current drawing, all data referenced through the FDO connection, will trasform automatically.


- DEM needs to be exported to DXF in order to create surface. In fact, both Map 3D and Civil 3D can create surfaces out of DEM data.

- GIS data is flawed with bad data. For the most part, you have to know what you’re playing with. During the data creation stage of many of these data sources, they are digitized at a scale of 1:24000 or greater. I don’t know about you, but my digitizing stunk and I was the best of the group. Now magnify that inherent digitizing error over 1″=2000′. Now you know why data when plotted at 100 scale is not accurate at all. The way to know what kind of data accuracy you’re using is contained in something called metadata, or data about the data. In this, you find who created the data, why they created it, what was their source, how was it created, how to contact them, etc. So, is GIS data flawed? No more so than using a Landscape Architects sketch as the final design. Unless, of course, they did it in Impression. 🙂
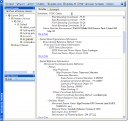


If nothing else, realize that that annoying task pane that most people close down in Land Desktop is actually the doorway into the Map GIS world. If you’d like to know more, please contact me at my day job and I’d be glad to help you myself or point to someone in your area that can also help.
Hope this helps!

Before you beat on the guy, note: “G. James Dronick is a senior student in the Penn State University Surveying Engineering Program in Wilkes-Barre, PA. He worked fulltime for WJP engineers in the summer and continues to work there part-time during the semester. This paper was an assignment for the Seminar in Surveying course, a requirement for B.S. Surveying Engineering candidates.”
Also, it looks like he only had acces to AutoCAD, not Map, etc.
LikeLike
I agree, I wasn’t trying to beat on the guy. What’s funny is that his experience is commonplace I’m finding, when it comes to GIS stuff. Most engineers don’t even know they have Map software if they have Land Desktop or Civil 3D; It’s builtin! That’s really what I was trying to address, not specifically his issues. Oddly, his issues are, for the most part, common. Were you aware of Map? Do you read Prof. Surveyor?
LikeLike
Please pardon my enthusiam. Sometimes in my haste to help educate, I ‘m not to smooth with the words. I did realize that James was early on in his career and his boss probably had little direction for him given the context with which he had to work. For that matter, that is how most land development firms operate in my experience. We get a job, have an idea how to do it, but do it regardless of how much time or effort it takes.
Peace
LikeLike
Thanks for not beating on me too much. You are correct that I did not have access to Land Desktop or Map. Only ACAD and Eagle Point. Please realize that the intended audience for this paper was my fellow students at PSU, many of whom work for small surveying firms that do not realize the productivity potential of GIS. My objective was twofold. First, to demonstrate that GIS technology can be utilized in the surveying world for under $500. Second, to show my classmates the many resources that are available on the PASDA website.
Kevin, I was aware of Map and I do read P.S. I’ve been doing this for a little while, now. (Graduated with my first engineering degree in ’96.) I’m just trying to spread the love. There are a lot of folks out there that are amazed that this technology even exists.
LikeLike
James… if nothing else, please do not take anything i said as cristicism. It’s funny, now that I’m on the reseller side of things, I find that most if not all Land Desktop users have now idea what Map is nor do they know they own it already.
Now, i don’t know about you, but if i spent in excess of $3500 for a piece of software, i’d at least figure out what i got in the box. But we were always too busy to care, honestly. Ironic when you think about it. There we are trying to find a more efficient way to do things and don’t spend the time to even look at what’s in the box that’ll make lots of things more efficient.
That was really the audience i was going after. Those “too busy” people wishing they had a GIS program…. 🙂
Sorry for any misunderstandings….
LikeLike