Living in Pennsylvania, the Marcellus Shale has had a positive business impact on firms in and around the area. With that, the Oil & Gas industry has brought a new way of creating design documentation than we have been accustomed to doing in the past. For instance, the pipeline will stretch many miles and cross many properties. And as is often the case, easements will have to be obtained. So along the pipeline concept plan will have to be some documentation of property impact.
Along comes the idea that in the profile, we add a band indicating the station at which a parcel line crosses the alignment. And, in between those “crossings,” we indicate who owns that parcel.

So, how do we do that?
For the moment, there is no native way to accomplish with Parcels. BUT, we can use the dynamic nature of the model to mimic our situation with the objects that will give us the intended results. Our object of choice in this case will be a single Pipe Network. The network will be made up of structures representing the parcel lines we cross. Then, we’ll use pipes between structures containing the parcel information. Incidentally, we don’t care what the pipe inverts do during this process since we don’t need to utilize that information at all. It’s not perfect, but it helps with the constant alignment changes that occur during the evolution of a pipeline route.
First, the parcel line “structures”. In the data band, we are interested in the station value, a band tic and a text to indicate a property line. So we need to create a profile view band style under pipe networks to get this to work.
Under Settings Tab, Profile View>Band Styles>Pipe Network create a new style called something like Parcel Info.
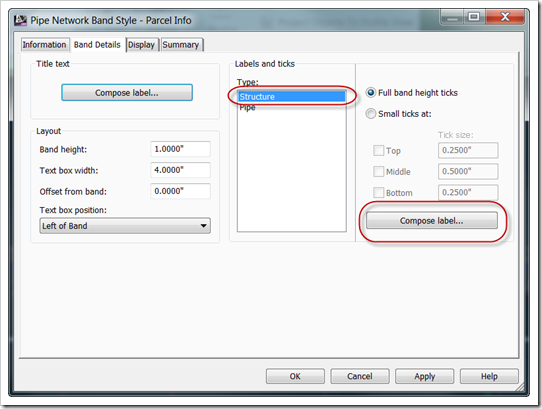
Switch to the Band details tab so we can set a few things. Number 1, let’s do the easy part and edit the Title of the band to be appropriate. Click “Compose label…” to do this part. Then edit the text contents. You might change this to something like ownership. Next, we need to adjust the labels for both structures and pipes. For now, we’ll focus on structures.
Make sure you select “Structure” and click label…
We’ll format the label to have a rotation angle of 90 degrees so it reads along the tic line and then edit the contents. We’ll insert the station value and adjust the precision as needed and add any regular annotation as desired. For our example, I added the property line symbol. Now our band style, when added to the profile, should look something like this:
All we need now is the parcel information to show up between the “property line” tics and we’re done!
I’ll share that in the next post….


